


The problem
Inspection tells you what's wrong. It doesn't tell you why.
Most plants can see a bad part. Few can say, in the moment, which machine condition made it.
Found too late
Defects surface at the end of the line
By the time a roll, batch or bin is checked, the line has been making the same defect for hours.
Days of digging
Root cause lives in spreadsheets
Quality and process engineers pull trends from SCADA, line logs and lab results by hand to find what changed.
It comes back
The same defect repeats
Without a confirmed cause, the fix is a guess, and the defect returns on the next shift or the next grade.
From defect to cause in four steps.
Vision and machine data, joined second by second.
See
AI vision stations inspect the product on the line and flag each defect with an image, a type and a position.
Link
Each defect is matched to what every relevant machine was doing at that moment: temperatures, speeds, pressures, settings.
Explain
AI ranks the likely causes, shows the evidence behind each one, and lists what it ruled out.
Act
Your team gets a recommended fix. Out-of-limit product can be held automatically, and maintenance is notified.
Explainable AI
An answer your engineers can check
No black box. Every explanation shows its working, so the team can trust it or challenge it.
Causal chain
Step by step from the machine condition that changed to the defect it produced.
Evidence with numbers
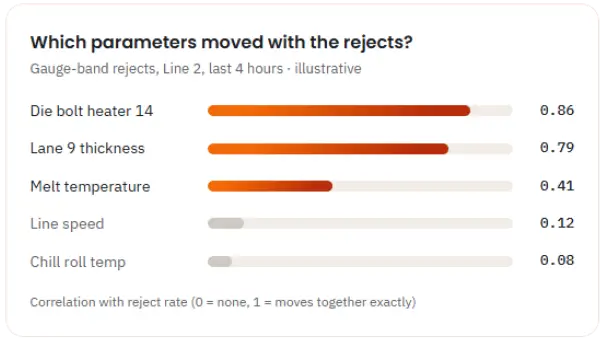
How strongly each runtime parameter tracked the rejects, shown on the parameter's own trend chart.
What was ruled out
The usual suspects it checked and cleared, so nobody wastes a shift chasing them.
Corrective action
A specific next step, with a link straight to a maintenance work order when a part is at fault.
What's inside
Everything quality needs, on one screen

Quality Cockpit
Live yield, reject rate and open alerts for every line, plus the health of every vision station.

Reject Stream
A running log of every reject with its image, defect type and the AI's cause, filterable by line, shift and grade.

Causal Analysis
The investigation view: runtime parameter charts, the causal chain and the evidence behind it.

Defect Pareto
Defect families ranked by yield loss, each with the runtime driver behind it, so you fix the biggest losses first.

Vision Stations
Every camera on one grid with live status, so a dirty lens or an offline station never hides defects.

Spec & Limits
Auto-hold thresholds per product grade, tied to the process limits that keep product in spec.
By industry
The defects we link to their causes
Built for processes where quality depends on how the machines run, second by second.
Specialty Chemicals
Plastic films · Packaging materials · Adhesives
| Defect | Typical cause | |
|---|---|---|
| Gauge bands | → | Die bolt heater drift |
| Gels and black specks | → | Melt temperature, screen pack pressure |
| Wrinkles, breaks | → | Tenter chain and tension settings |
| Coating weight off | → | Line speed, dryer temperature |
Discrete Manufacturing
Auto components · Precision engineering · Press shops
| Defect | Typical cause | |
|---|---|---|
| Burrs, cracks | → | Die wear, press tonnage |
| Out-of-tolerance dimensions | → | Tool wear, spindle temperature |
| Surface marks | → | Coolant flow, feed rate |
| Missing features | → | Fixture or sensor faults |
Paper Mills
Kraft · Duplex board · Writing and printing
| Defect | Typical cause | |
|---|---|---|
| Holes and spots | → | Wet-end consistency, felt condition |
| Caliper variation | → | Press loading, steam pressure |
| Moisture streaks | → | Dryer section temperatures |
| Web breaks | → | Draw and tension settings |
One platform
Quality connected to the rest of the plant
Quality Intelligence runs on the same data as the other three pillars, so a cause found here becomes an action there.
Maintenance Intelligence
When the cause is a failing part, like a heater, a bearing or a worn die, a work order goes straight to maintenance with the evidence attached.
Execution Intelligence
Rejects feed the quality factor of OEE automatically, so scrap shows up as lost output by line, shift and job.
AI Advisor
Your top recurring defects and their fixes appear in each role's daily actions, from operators to the plant head.
We start with one line and the defect that costs you most. You see it explained on your own data before you decide on a wider rollout.
